Make Millions with These Insider Tips: Crack the Code of Technical Analysis for Price Prediction!
Understanding Technical Analysis for Price Prediction
When you want to guess what the price of something might be in the future, like a cryptocurrency, you can use something called technical analysis. This involves looking at how the price has behaved in the past, the trends in the market, and some special signs that might give hints about where the price could go. Let’s break down some important technical details to help us make predictions:
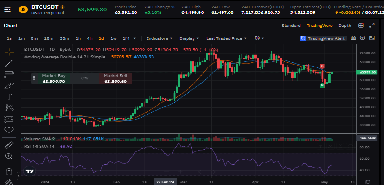
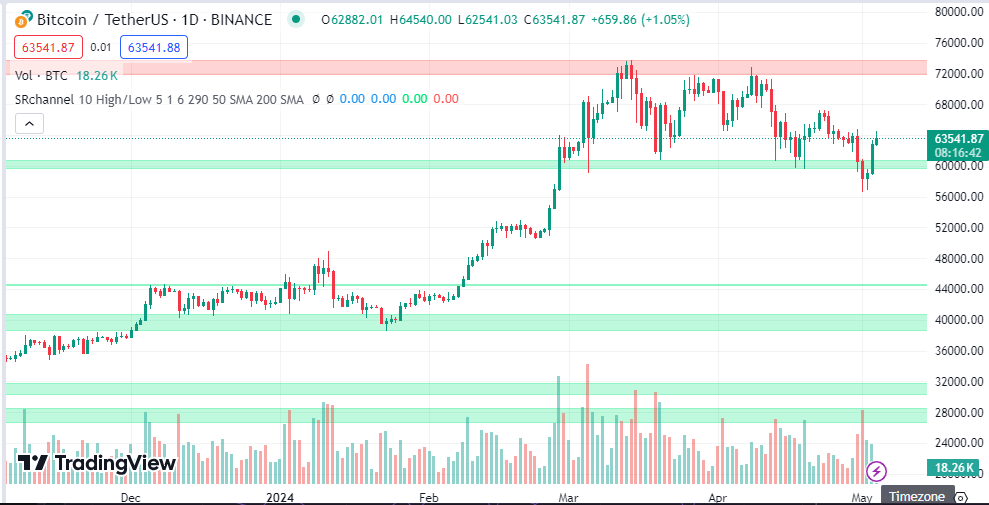
1. Support and Resistance Levels
In the past, there have been some price levels where it seems people really wanted to buy or sell. We call these support and resistance levels. They’re like big signposts in the market, showing where the price might bounce back or stop moving.
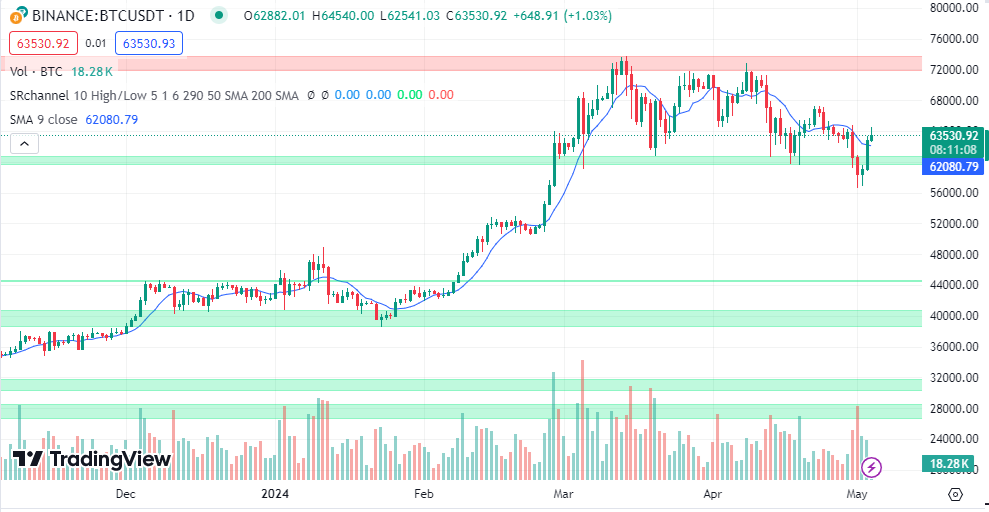
2. Moving Averages
Think of moving averages like a smooth line that shows the average price over a certain number of days. For example, the 50-day and 200-day moving averages give us an idea if the price is going up or down over a longer time. When these lines cross each other, it could mean the trend is changing.
3. Relative Strength Index (RSI)
RSI is like a speedometer for price changes. If it’s above 70, it means the price might have gone up too fast and could drop soon. But if it’s below 30, it could mean the price went down too fast and might bounce back up.
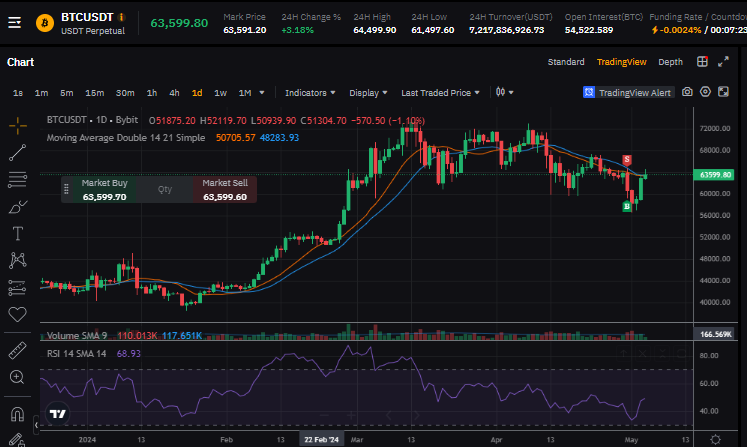
4. Volume Analysis
Trading volume tells us how many trades happened. If there’s a lot of trading going on during a big price change, it shows there’s a lot of interest in that price move. This could mean the trend is strong.
5. Chart Patterns
Sometimes, if you look at the price chart, you can see shapes or patterns. These patterns can give us clues about what might happen next. For example, if the price makes a shape like a triangle or a head with shoulders, it could mean the price will do something specific soon.
When we use these technical indicators, we shouldn’t forget about other important things like news and what people feel about the market. Cryptocurrency markets are wild and can change fast, so we should be careful and not rely only on technical analysis.
Analyzing Solana’s Price
Now, let’s talk about how we can use technical analysis to guess Solana’s price. We can’t predict exact prices because I’m not a fortune-teller, but we can use some tools to make educated guesses:
1. Moving Averages (MA)
By looking at moving averages, we can see if Solana’s price is generally going up or down over time. The 50-day and 200-day moving averages help us understand long-term trends.
2. Relative Strength Index (RSI)
RSI gives us hints if Solana’s price is too high or too low compared to its past performance. This can tell us if it might change direction soon.
3. Bollinger Bands
These are lines that wrap around the price and show us if it’s moving too much or too little. When the price breaks out of these lines, it could mean a big move is coming.
4. Volume
High trading volume when the price changes a lot shows us that many people are interested in that price move. This can confirm if a trend is strong.
To make a guess about Solana’s price, we can look at its history using these tools and see if there are any patterns or trends. But we should also remember that things like new developments or how people feel about Solana can also affect its price.
In the end, we should be careful and do lots of research before making any big decisions in the cryptocurrency market. It’s a wild ride, and we want to make sure we’re as prepared as possible.